Miami Rental Yields by Neighborhood
Miami rental yields vary more within a neighborhood than between neighborhoods. A Brickell tower with flexible rental policy can produce 7% gross while the tower next door produces 4%. Neighborhood averages are a starting point — building-level modeling is where investors actually make money. This guide from the Supreme Capital Real Estate advisory maps current yield expectations across Miami's principal rental submarkets, alongside the rental representation and buying advisory for investor clients.
Quick Answer
A Miami broker's neighborhood-by-neighborhood rental yield analysis — gross yield, net yield, and the drivers that separate buildings within each submarket.
How to Read a Miami Rental Yield
Gross rental yield is annual rent divided by purchase price. Net yield subtracts HOA fees, property tax, insurance, maintenance reserve, vacancy, and management. In Miami-Dade, net yields typically run 60–75% of gross because HOA fees on luxury condos are substantial and insurance has escalated sharply since 2022. The National Association of Realtors tracks Miami-Dade among the top U.S. metros for rental transaction volume, and the Miami-Dade County Property Appraiser publishes assessment data used in every underwriting. Tenants and landlords can review our approach to rental representation in Miami.
Brickell — Yield Anchor of Miami-Dade
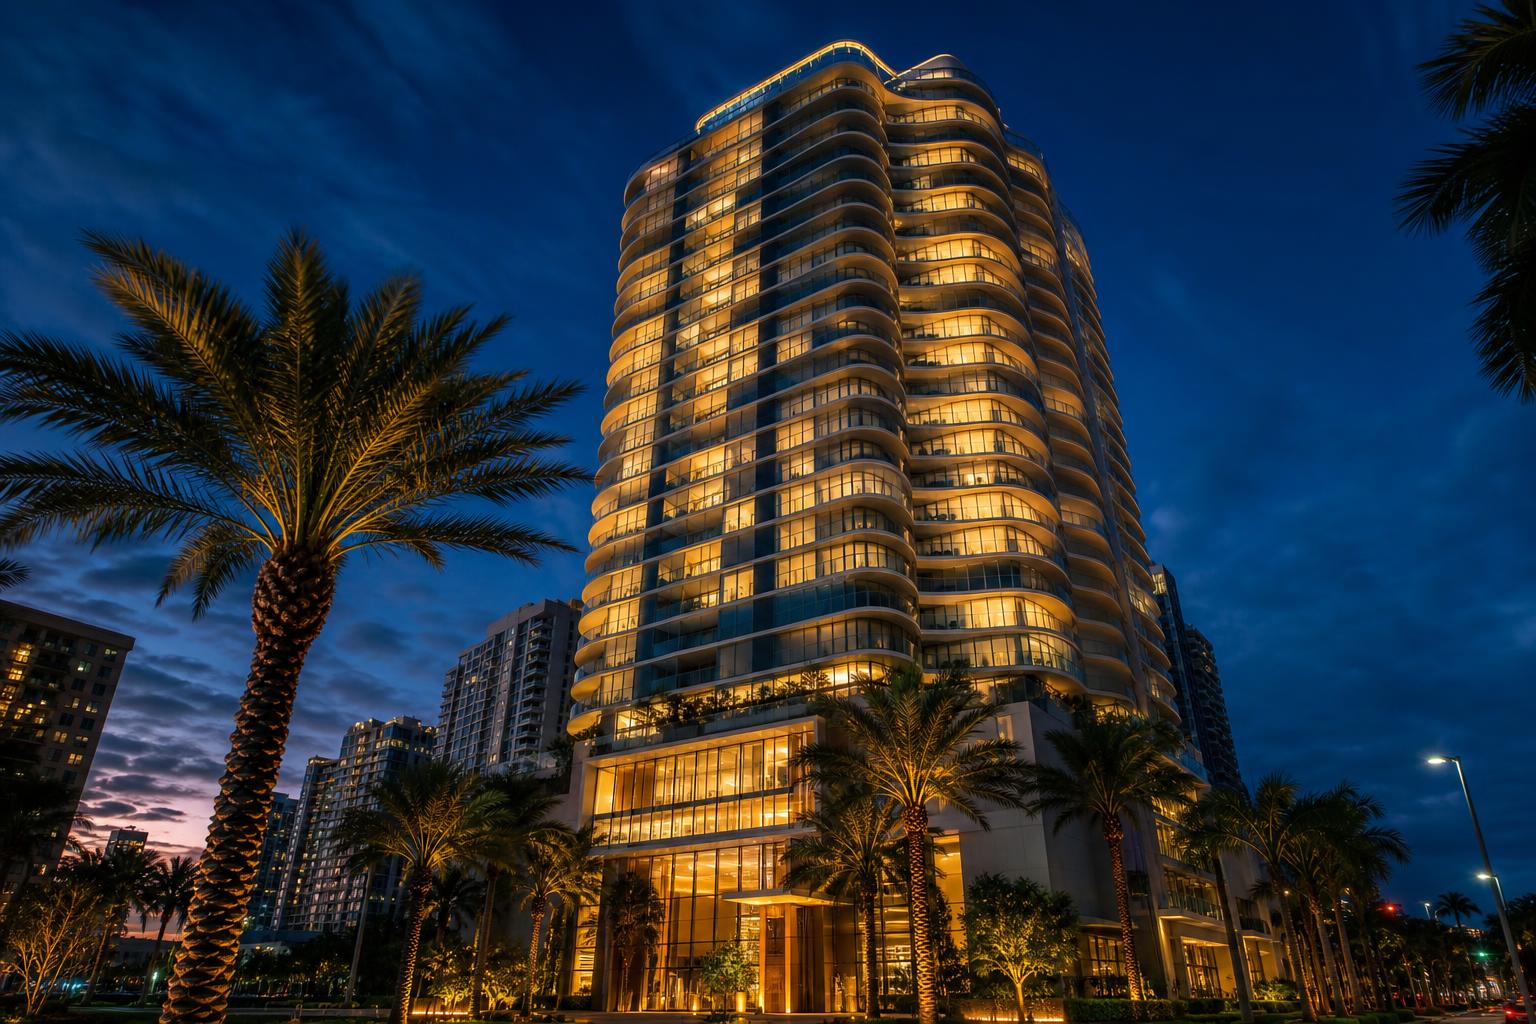
Brickell is Miami's deepest urban rental market. One- and two-bedroom condos in quality buildings routinely produce 5%–7% gross yield, driven by finance, legal, and tech professionals plus a large international relocation pool. Occupancy in well-managed buildings exceeds 95% and turnover cycles are short. Buildings with flexible rental policies (allowing 30-day minimums) capture the higher end; buildings capped at 12-month minimums produce the lower end at higher stability.
See the Brickell neighborhood guide for building-level rental policy notes and the Brickell real estate agent page for local advisory.
Edgewater and Midtown — Yield With Newer Inventory
Edgewater has emerged as one of Miami's strongest yield submarkets. New construction from 2018 onward — Paraiso, Missoni, and adjacent towers — trades at lower price per square foot than comparable Brickell inventory while capturing similar rental demand. Gross yields commonly land at 5%–6% with strong occupancy. Midtown offers a similar profile with more mixed-use energy.
See the Edgewater condos guide for building-level rental context.
Miami Beach — Building-Dependent, STR-Sensitive
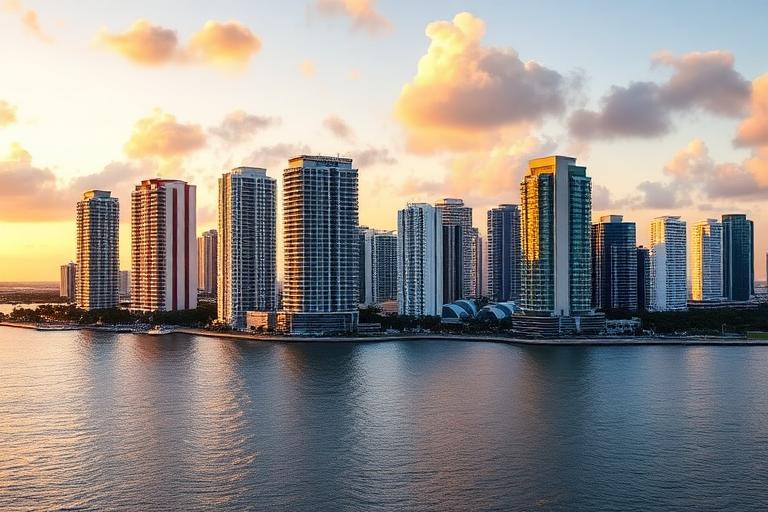
Miami Beach yields depend almost entirely on the building and the STR regulatory posture. Buildings with 30-day-minimum flexibility and STR eligibility in designated zones produce premium yields, especially during peak season (November–April). Buildings capped at 6- or 12-month minimums produce lower gross yields but stable, high-quality tenant profiles. Insurance and HOA fees are among the highest in Miami-Dade, so net yield modeling is essential.
See the Miami Beach condos guide and the short-term vs. long-term rules before modeling.
Coral Gables and Coconut Grove — Appreciation Over Yield
Single-family homes in Coral Gables and Coconut Grove typically produce 3%–5% gross yield. The tradeoff is stronger long-term appreciation, driven by scarcity, lot patterns, and neighborhood character. These submarkets tend to attract longer-tenure tenants, which can lower turnover and offset the lower gross yield.
See the Coral Gables guide and the Coconut Grove guide.
Emerging Value Corridors — Little Havana, Allapattah, Little River
Below-median-price neighborhoods can produce 6%–8% gross yield today with meaningful appreciation upside as infrastructure investment continues. These corridors carry more tenant-quality variability and require experienced local management. For investors comfortable with active management, they represent the highest current yield in Miami-Dade.
From Gross to Net — What Actually Reaches the Owner
Model every candidate with full deductions: HOA (highest impact in luxury buildings), property tax (~2% of assessed value in Miami-Dade), insurance (up sharply, budget conservatively), maintenance reserve (5–10%), vacancy (5–8%), and management fee (8–10% if outsourced). Net yield typically lands at 60–75% of gross. For international owners, layer FIRPTA planning per the taxes for foreign property buyers guide.
Related Miami Real Estate Services
Miami Rental Advisory
Broker-led yield modeling, lease structuring, and end-to-end landlord representation.
Miami Buying Advisory
Investor-focused acquisition strategy — building qualification before closing.
Miami Real Estate Market
Pricing, absorption, and market cycle data across Miami-Dade.